Death by Dashboard
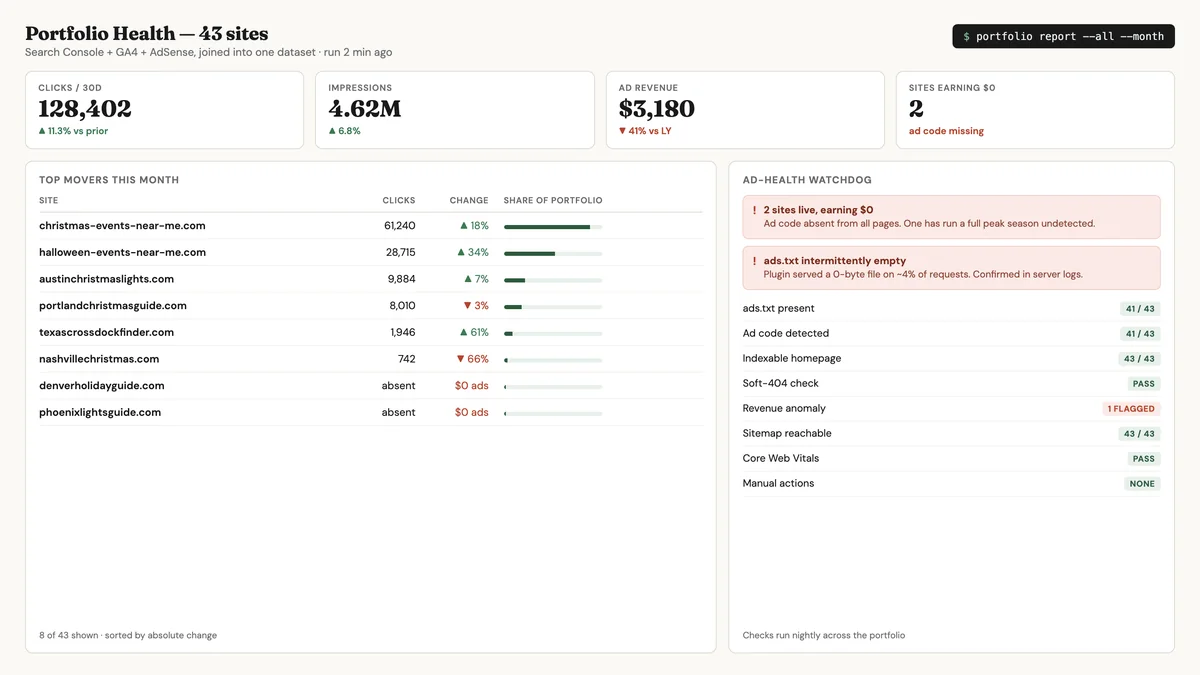
We operate a portfolio of 43 websites — local guides, directories, and business sites. Checking on them the normal way means clicking through Search Console and Analytics one property at a time: an afternoon of tab-juggling to answer a question as simple as “which sites gained traffic this month?”
Cross-portfolio questions — the ones that actually drive decisions — were effectively unanswerable by hand. So we built tooling that treats all 43 sites as one dataset.
The question: What do you learn when your entire web presence is queryable at once — and what has it been quietly costing you not to know?
One Key, Every Property, No Login Dance
Elegant Access
One service account gets added as a read-only user on every Search Console and Analytics property. No OAuth popups, no per-site credentials — adding a new site to the system is a one-minute permissions change.
Portfolio Reports
Command-line reports rank all sites by a composite score, surface keyword opportunities (high-impression queries sitting at positions 5–20 — the almost-ranking money queries), and flag movers between periods.
Revenue Forensics
Search, traffic, and ad-revenue data joined into one daily time series per site — so a revenue change can be decomposed into its actual cause: traffic loss, ranking shift, ad-rate softening, or broken ad plumbing.
Automated Ad Health Checks
A watchdog fetches every monetized site and verifies its ads infrastructure is actually present and serving — because an approved ad account with a missing script earns exactly zero, and no dashboard tells you.
What the Tooling Caught
- Diagnosed a revenue collapse correctly. When seasonal ad revenue dropped ~85% year-over-year, the joined data pinned 86% of the loss on one site hit by a Google algorithm update — and corrected an optimistic recovery estimate that would have misdirected months of effort.
- Found sites earning $0 silently. The ad-health watchdog caught two approved, live sites whose ad code was missing — one had gone a full peak season undetected.
- Solved a recurring mystery. A monthly “missing ads.txt” warning that manual checks could never reproduce was traced to a plugin intermittently serving empty files — proven with server logs, fixed permanently.
- Turned strategy reviews into queries. “Rank all sites,” “show me almost-ranking keywords,” and “what moved this month” each run in seconds.
Your Dashboards Know Things You Don't
Most businesses run on data scattered across five vendor dashboards that don't talk to each other. Custom tooling that joins them used to be an enterprise-only luxury; with AI-assisted development it's a small project. The payoff isn't prettier charts — it's catching the silent failures and misdiagnoses that scattered data hides.